Between 1 January and 31 July, Valenciaport managed almost 44 million tonnes and 2,948,630 containers; two different ways of measuring traffic, which represents decreases of 8.85% and 9.43% compared to the same period last year
Valenciaport’s traffic data confirm that the Spanish economy’s import/export is on the road to recovery, leaving behind a month of May that saw losses of close to 20%.
Despite the economic effects of the COVID-19 Valenciaport scored the previous month as the third best July in its history with nearly 440,000 containers managed
The non-metallic mineral and agri-food sectors continue to be the most stable during the Covid-19 crisis, in contrast to the general decline in other activities
Commercial activity with countries such as Algeria, Canada, Italy, Saudi Arabia and the United Kingdom is growing significantly
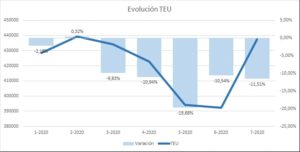
The traffic data for the month of July in Valenciaport continues to be conditioned by the Covid-19 crisis and reflects the slowdown in business and commercial activity that is affecting the Valencian, Spanish and world economy. According to the figures of the Port Authority of Valencia (PAV), July showed a decrease of 11.5% in the movement of TEUs (20-foot container unit) compared to the same month last year. This is a data that is again negative, but it is far from the 19.68% fall registered last May, as can be seen in the following graph; a box in which the blue columns show how in February the first impact of the Covid-19 crisis was already detected with a reduction of container movement with respect to February of the previous year of 9.83%. In April, this impact was aggravated by raising the fall to 10.94%, only to bottom out in May with almost 20% negative.
In June, the cut was already 10.54% and in July it was 11.51%; both figures on the path to recovery, even more so as these are months of great port activity and greater volumes of traffic, as the continuous line of the graph shows.
 Figure1. Source APV
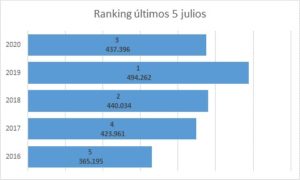
In fact, last July, Valenciaport managed 437,396 containers – the third best month in July in the historical series -, a figure lower than the historical record set in July 2019 (see box below), but very similar to that of 2018; the year in which the port exceeded 5 million containers.
 Figure 2. Source APV
In more detail, with respect to exports and imports in Valenciaport, July reflects a decrease of 10.3% in full containers loaded (exports), a decrease of 17.6% in unloading (imports), while transit containers fell by 8.7%. A trend that is also detected in empty TEUs, which fell on average by 13.3%.
In relation to the accumulated values between 1st January and 31st July, Valenciaport managed almost 44 million tonnes and 2,948,630 containers; two different ways of measuring traffic, which represent decreases of 8.85% and 9.43%, respectively, compared to the same period in 2019.
Seen from a year-on-year perspective, over the last 12 months, the Valencia, Sagunto and Gandia docks have handled more than 76 million tonnes and 5,132,782 containers, down 4.4% and 6.3% respectively, compared to the same period last year.
In the case of Valenciaport, as it is a “mixed hub” port that combines almost 50% of the import/export traffic of Spanish companies and transit traffic from Valencia to other countries, the figures and trends recorded by the Port Authority reflect what is happening to companies in its hinterland; a geographical area where 50% of Spanish GDP is generated and where 60% of Spanish foreign trade is located.
Traffic by sector and geographical distribution
But July also brings positive indicators. Thus, by type of activity, the non-metallic mineral sector is the most dynamic with growth in the first seven months of the year of 18%, while the energy and agri-food sectors have maintained similar figures to the previous year. In the latter sector, the increase in exports of canned goods by 7.2% or other food products, which grew by 19.7%, is noteworthy. The rest of the sectors presented negative results such as vehicles and transport with a 17.8% decrease or construction materials (-10.5%).
By country, the USA remains the main trading partner of Valenciaport with nearly 291,000 TEUs managed between January and July, a figure that represents a decline of 5.7%. It is followed by China (-10.8%) and Turkey (-18.9%), while in fourth place is Algeria with nearly 150,000 containers and an increase of 16.2%. In the first seven months of 2020, the dynamism of activity with Canada (traffic growth with Valenciaport of 21.3%), Italy (+14.7%), Saudi Arabia (+9.7%) and the United Kingdom (+55.6%) stands out. Managed containers from the Far East fell by 11.9%, Mediterranean and Black Sea (-6.1%), West Africa (-10%) and South America Atlantic (-20.5%).
Passengers and ro-ro
The closure of the cruise activity and the uncertainty generated by the Covid-19 is having a significant impact on passenger traffic that in July only recorded movement with the islands for 55,015 people a -29.4% compared to the previous year, while the cumulative decline of the year is 39.6%. In ro-ro traffic the decrease in July was 34.6% for a total of 40,600 units.

