Valenciaport generates 50,000 jobs per year, 2.5% of the total of the Valencian Community. This is according to the results of the Economic and Social Impact Study of the Port Authority of Valencia (APV) prepared with data for the year 2019 and independently prepared by the consulting firm Analistas Financieros Internacionales (AFI) and the company Prometeia for Valenciaport.
The results of this report give continuity to the information analysed in the previous economic impact study carried out by the Polytechnic University of Valencia (UPV), focused then on the year 2016. If we compare both studies in terms of employment and Gross Value Added (GVA) data, the strength of the port of Valencia as an engine of the economy of the Region is confirmed.
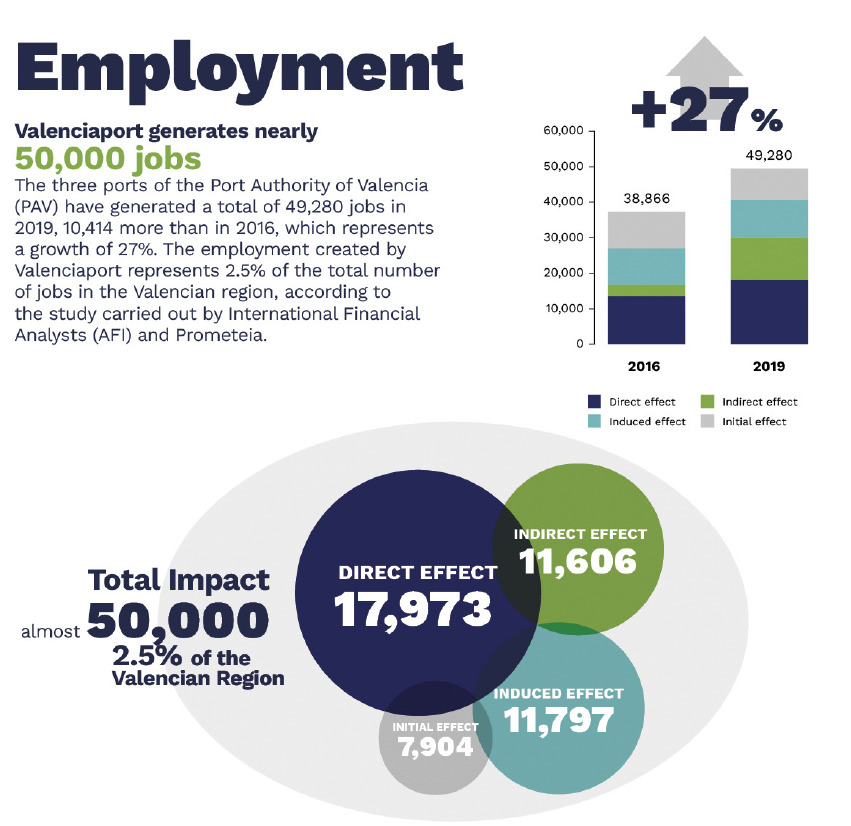
These 50,000 jobs would indicate that, in three years, the docks managed by the Port Authority of Valencia have employed 10,414 more people (an increase of 27% compared to 2016).
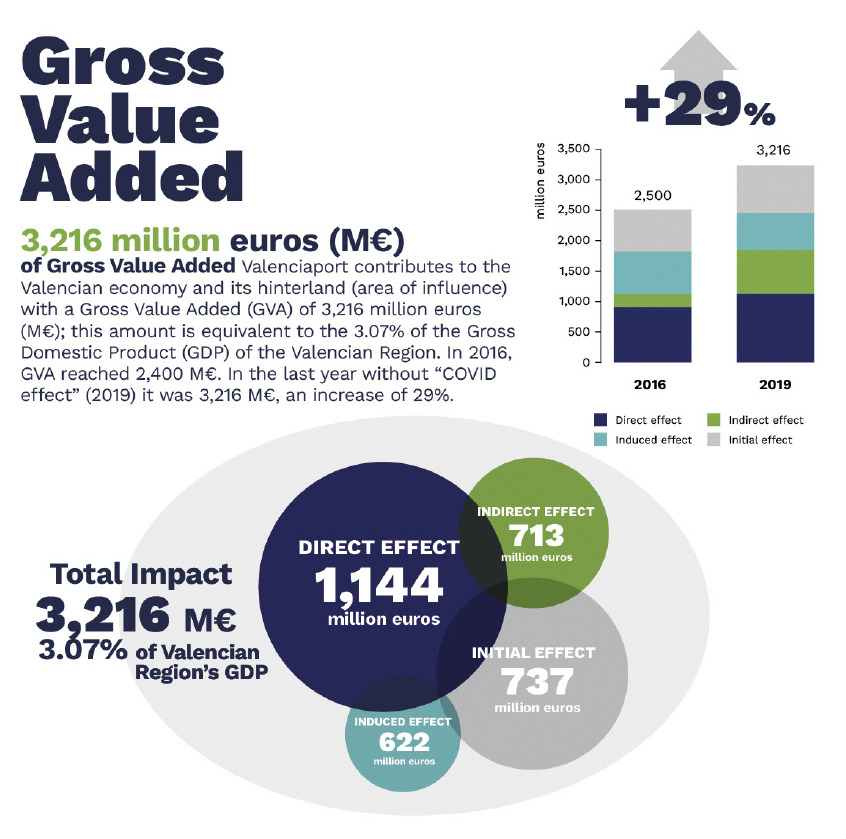
In relation to the GVA, this was evaluated by the Polytechnic in 2016 at 2,500 million euros (which represented 2.39% of the total Gross Domestic Product of the Valencian Community). Three years later, AFI/Prometía put this added value at 3,216 million euros (a figure equivalent to 3.07% of the total GDP of the Valencian Community). Comparing the two, it can be seen that in three years, the contribution of the port to the GVA of the Region and its hinterland has increased by 716 million euros (an increase of 29%).
Multiplier effect on the economy
The results of the study of the Economic and Social Impact of Valenciaport also reveal the relevant multiplier effect of the three precincts managed by Valenciaport since, for every euro that is generated in them, the economy of the Comunitat produces an additional 3.3 euros. Along the same lines, it points out that every job created in the port area generates another five jobs in the three Valencian provinces as a whole.
In relation to salaries, the report highlights that the gross salaries of the port companies are almost double the average for the Comunitat and its dragging effect means that the salaries that directly or indirectly derive from the activity of Valenciaport are also above the average.
With regard to tax revenue, this study reveals that the public coffers received 227 million euros in 2019 from the economic activities linked to Valenciaport, a figure that represents 26% more than in 2016.
The best-connected port in the Mediterranean
The Port Authority of Valencia manages one of the most important logistics hubs in Spain and leads the ranking of Spanish ports with the highest container traffic. It is also a reference at European level in that Valenciaport ranks fourth in the number of TEUs handled. In this sense, the report points out that Valenciaport represents 20% of the automobile traffic of the total Spanish port system, 20% of the ro-ro traffic and 40% of the total import/export container traffic of all the national ports.
The Valencian precinct is the first in Spain in terms of international connections, a connectivity that has led it to occupy 21st place in the UNCTAD World Connectivity Index (LCSI).
Valenciaport, at the service of people
The Economic and Social Impact Study of Valenciaport also provides outstanding figures on the solidarity activity of the Valencian port community. It focuses mainly on the balance of activity over the last decade of Aportem – Puerto Solidario València. This association – declared of public utility and totally private – is made up of 40 institutions, companies and individuals linked to the port sector and the Maritime District of Valencia. Its actions are mainly focused on the surroundings of the Valencian precinct, with special attention to the care of the environment and the most vulnerable people living in the neighbouring districts.
According to the report, Aportem collaborates on average with 36 organisations, more than 1,000 children and 250 families per year. Among its main figures over the last decade, the donation of 20 tonnes of food, almost 20,000 items of clothing and more than 18,000 sports kits delivered since its creation stand out.
On the methodology used to prepare the report
The Economic and Social Impact Study of Valenciaport, elaborated independently by the consultancy Analistas Financieros Internacionales (AFI) and the company Prometeia for Valenciaport, has used the Imput-Output analysis methodology. Thanks to this system, it is possible to estimate the relevance of the PAV ports on the economy of the Region in terms of Gross Value Added (GVA) and full-time equivalent employment at four levels: initial effect + direct effect + indirect effect + induced effect.
The initial effect represents the impact of the port cluster companies’ own activity. The direct effect is the impact derived from the demand for supplies needed to develop the activity of the cluster companies in the port area. The indirect effect represents the impact derived from the demand for supplies necessary for the auxiliary activity of the port. And the induced effect is the impact of the consumption derived from the turnaround of the wage income generated by the previous impacts. Therefore, the results of this report give continuity to the information analysed in the previous economic impact study carried out by the Polytechnic University of Valencia (UPV), which focused on 2016 and used exactly the same methodology.